Newspapers Don’t Know Your Financial Plan
In theory, the process of capturing long-term public equity market returns is straightforward. In practice, it’s common to lose faith in the markets, question the future of its returns, and make reactionary changes in the short term.
In our opinion, it’s crucial to review historical market returns and fluctuations on a routine basis to remain on track. Although the performance is not guaranteed to occur in the same fashion in the future, the past data helps put things in perspective.
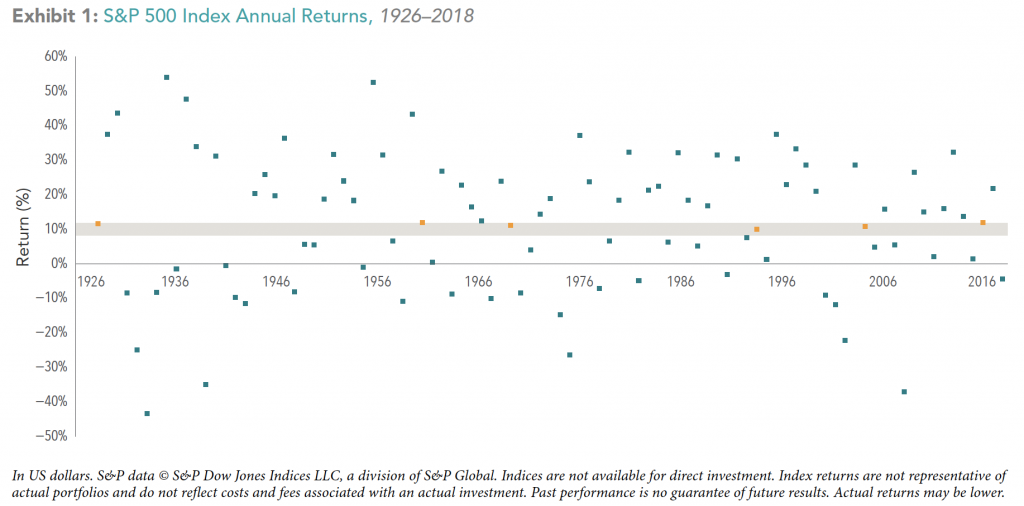
Historical Annual Return Dispersion – US Market
Exhibit 1 does an excellent job of illustrating how infrequently the annual market returns fall within a +/- 2% range of the historical average. The scatterplot shows that only 6 of the past 93 calendar years have fallen in this range (shaded band in the exhibit). It’s challenging to remain focused on the long term when experiencing this wide dispersion of returns each year. However, those who stay invested and disciplined over long periods of time are compensated.
Rolling Returns
The following percentages illustrate the experience for an investor over multiple rolling periods. Here are the highs and lows since 1972 for 1, 3, 5, 7, 10, and 15-year rolling return periods for the US Stock Market.
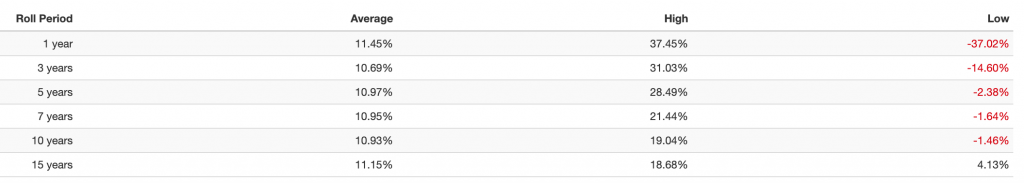
It’s important to note in this data that 10-year returns can be negative, something experienced as recent as 2010. However, 94.7% of all 10-year rolling periods and 87.7% of 5-year rolling periods have been positive from 1926 to 2018.
For more reading please see the The Uncommon Average for more detail.
-TCM
Exhibit’s Source: Dimensional Fund Advisors Canada ULC (Dimensional Canada).